FTCScout Season 2: What's New
By Daniel James on October 15, 2023
This offseason we rewrote FTCScout from the ground up. In the process we made many improvements, fixed lots of bugs, and added cool new features. Here is a fairly exhaustive list of what's changed.
New Features
- Center Stage!: We now have the 2023-2024 season Center Stage!
- Dark Mode!: FTCScout is the first FTC website with dark mode. Enable it by clicking the moon icon in the top right. Your preference will be remembered and your operating system preference respected. Let us know if there are any dark mode visual bugs or things that don't look great.
- Matches Update Without Refresh: If you are viewing the event page for a live event you no longer need to refresh the page to see if new matches have been added. The matches will be updated automatically as soon as FTCScout has them.
- Vote for the best team name: We are running a competition to see which team has the best name. On the home screen you will see two random teams. Vote for your favorite name by clicking it. Once we have enough votes we will write a blog post about the winners.
- Quick Stats: On the page for individual teams you will now see a "Quick Stats" section. This includes the team's best OPR for total points, auto points, teleop points, and endgame points. It also shows you the team's rank and percentile among all teams in each of those categories.
- REST API: We hear you. The GraphQL API is too complicated for quick queries. That's why we added a simple REST API for getting data about matches and events. You can read about it here. Note: If you are currently using the GraphQL API a small number of fields have changed names.
Improvements
- Numerous Visual Improvements: The visual style of the site has been slightly
reworked.
- No more shadows on cards throughout the website.
- Larger font sizes on mobile.
- More compact layouts. Less wasted whitespace.
- Nicer looking buttons, dropdown menus, and text boxes.
- The filter dialog looks significantly better.
- The header on stat pages now sticks to the top of the screen when you scroll.
- Team names aren't too large on stat tables and can still be seen on mobile.
- The list of related events uses just the name of the division.
- The awards page uses a two column layout and division awards are named correctly.
- Socials links in the sidebar look nicer.
- And more…
- Searchbar Rework: The searchbar in the top right of the screen has been reworked. It now loads all data immediately so future searches are instant. You can use the hotkey '/' to start a search. We've also switched to a custom search algorithm developed specifically for FTCScout. Let us know hot it works!
- Records and Custom Events: Events with modified rules are no longer included in the season records page or in the world record on the home page. The home page world record also no longer includes offseason events.
- Rank Only Best Results: You can now choose to only rank the best result by each team on the season records page. This is enabled by default.
- Team and Events Pages: The team and event pages have been redone to be much more useful. We can now recommend using the events page to find events. These pages also now use the custom algorithm the search bar uses.
- Livestream URLs: If an event lists a livestream url it is now displayed on the event page.
- Backend Improvements: The backend of the website has been redone so that all the information needed to define a season is located in a single file. This will make it much quicker to add future seasons.
- Performance Improvements: Certain actions are now much faster. For instance season records queries and search queries.
Bug Fixes
- Previously the teams for an event wouldn't show up until the day of the event. Now teams should show up as soon as the event publishes their team list.
- OPR was missing from the bottom bar when focusing a team at an event.
- Going to a team's page from an event from a previous season would take you to the wrong season.
- Match played times are now correct.
- Skystone tiebreaker points are calculated correctly.
- You can now scroll the page immediately upon loading instead of having to click something first.
- Typing in the searchbar before the page had finished loading would break it.
- Fixed a crash in the cone visualization.
- Fixed data being unnecessarily loaded on first load of the site.
As always we appreciate any feedback, bug reports, or suggestions you might have. Please email us or contact a dev on discord.
If you have any suggestions for topics you would like us to cover email us at [email protected].
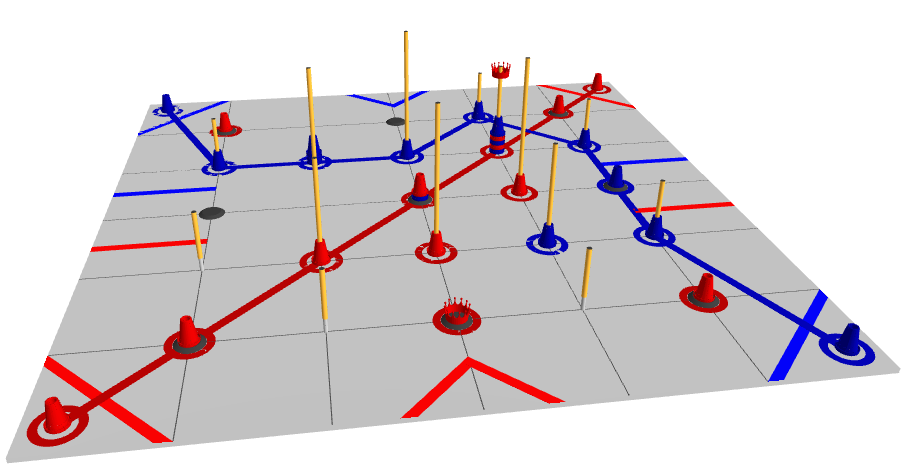 To see an interactive version of this visualization click the match score above.
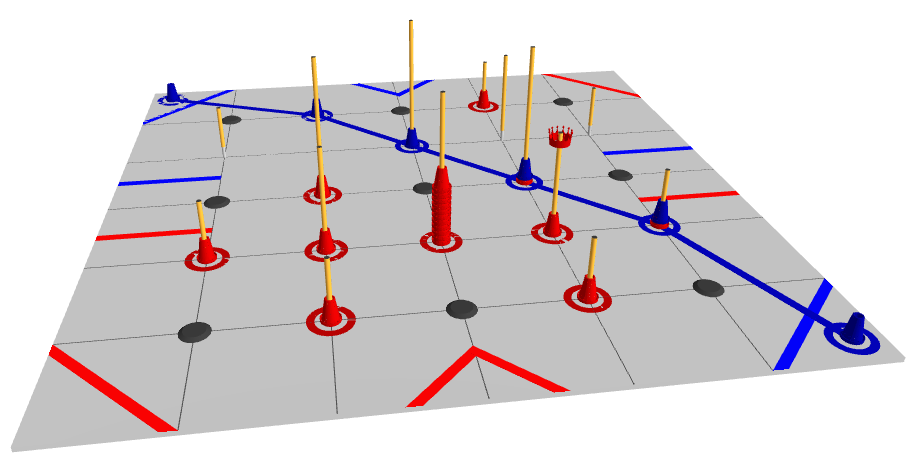 To see an interactive version of this visualization click the match score above.